Black people are a significant part of the US Economy. We are essential workers in many employment categories such as nurses, bus-drivers, government workers, teachers and warehouse workers. We are also highly visible as sports figures and entertainers. Blacks work in a wide verity of jobs and geographies. Together, we earn an estimated $1.3 Trillion Dollars.
For some perspective, there are about 47.8 million African-Americans(2018) in the US and they receive, spend or influence between $830 Billion (IRS) and $1.7 Trillion (estimated from personal income accounts[NIPA]). That is larger than ALL the spending in the country of Mexico and four times the GDP of Nigeria. Clearly Black workers earn a lot of money and Black people spend a lot of money.
There are four ways to estimate Black income: Ask on a survey, review tax data, calculate it from US total income data and capture actual spending data from businesses. We want to spend some time looking at each of these estimates. We are using data from the year 2018 which is the last year reported by the US census, the BEA, and the IRS. The two non government sources report yearly.
Earning and spending are different. Black workers reported earning about $1 Trillion dollars in 2018 on four important surveys: Current Population Survey(CPS), American Community Survey, Consumer Expenditure Survey(CEX) and Survey of Consumer Finances(SCF-2016). The CPS and the CEX are conducted by the US Census Bureau and the Bureau of Labor Statistics every year. The ACS is done by the US Census. Finally, the SCF is handled by the New York Federal Reserve every three years.
The largest estimate is $1.7 Tillion using data from the Bureau of Economic Analysis(BEA). It is based in National Product and Income Accounts(NIPA). The NIPA accounts capture all economic activity in the US economy. The estimate is calculated from the total US national income adjusted for the ratio of Black income to total US income. In other words, the Black share of national income. The ratio, the Black share of US income, is calculated from CPS household income ratios.
Finally, There are two other spending estimates. We are assuming that most spending is based on income (past or future), so the spending would be close to the income. One is from a private company, Neilsen and the second is a University research center, Selig at the Terry business school at the University of Georgia. Both release limited top level data and charge for their research details.
They both estimate US Black spending at $1.3 Trillion in 2018.
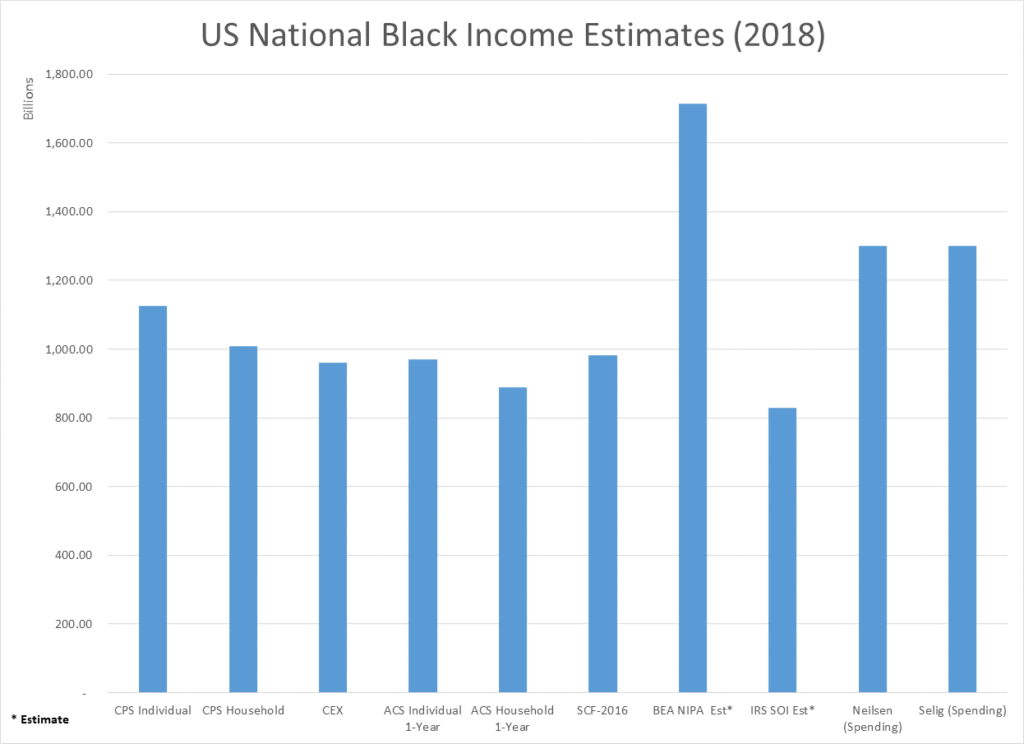
Table 1. Summary of Estimates and Sources for 2018
| Source | Amount (Billion) | Year | Comment |
| CPS Individual | 1,125 | 2018 | |
| CPS Household | 1,007 | 2018 | Used to calculated split ratios 2007-2018 |
| CEX | 960 | 2018 | |
| ACS Individual | 970 | 2018 | |
| ACS Household | 888 | 2018 | |
| SCF-2016* | 982 | 2015 | Data from 2015 adjusted for inflation to 2018 |
| BEA NIPA Est* | 1,714 | 2018 | Split by CPS Household Racial Income Ratios |
| IRS SOI Est (2018)* | 829 | 2018 | Split by CPS Household Racial Income Ratios |
| Neilsen (2018) | 1,300 | 2018 | Spending; Private methodology |
| Selig (2018) | 1,300 | 2018 | Spending; private methodology |
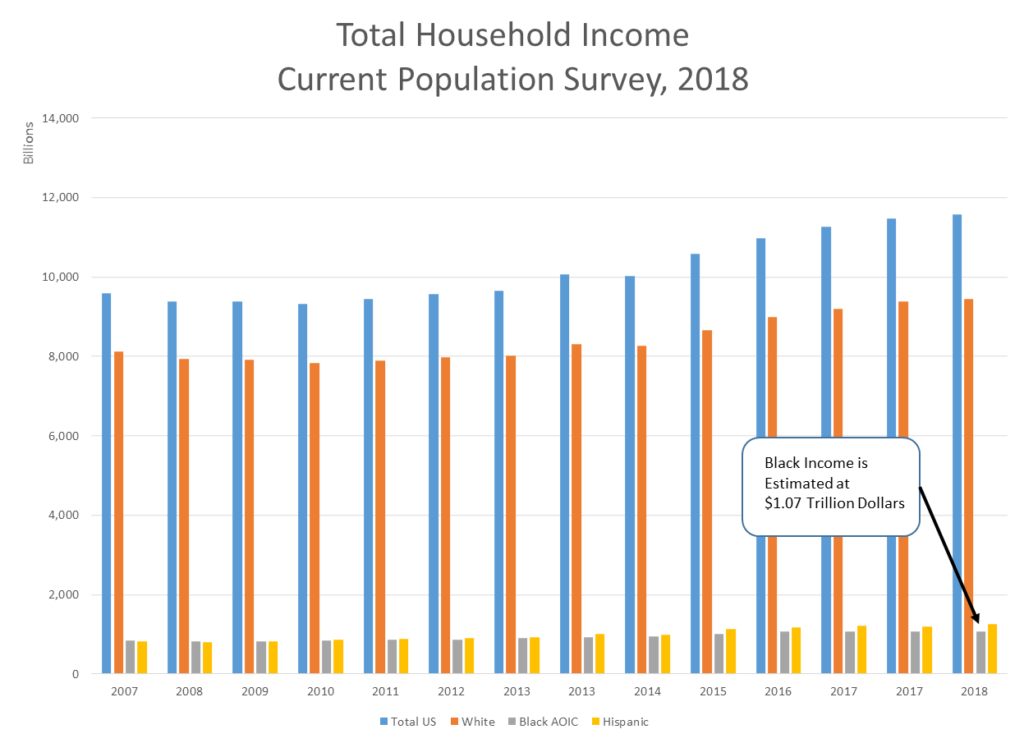
On the CPS Household survey, Blacks had an estimated income of $1.07 Trillion dollars.
National Black Income
How do define National Black Income ?
Black National Income, Black Income is Black Earning Power or the total amount of money available to Black People in the US. Black Disposable income is what’s left after taxes. Black Spending Power is disposable income minus savings.
Surveys that ask about National Black Income ?
four/five ways to measure national Black income: CPS, ACS, BEA NIPA and IRS SOI. SCF. Ed Note: Survey of consumer finances – 2016. CPS and ACS are from the US census. CPS is annual (December to December) while ACS is a rolling 1-year and 5-year data set. ACS and CPS contain explicit data on race while NIPA and SOI do not. NIPA should capture all income earned in the US.
NIPA data deserves special mention. It should capture ALL economic activity in the US economy since the economy is circular. Someones purchase is another persons sales. A business’s spending is some one else’s earnings. Total Sales = Business Income + Consumer Income = Total Sales.
In other words money flows in a closed loop through the economy. The money we spend has to equal the money we receive. So if we spend ($1.7 Trillion) then we earn $1.7 Trillion. Money does not grow on trees. (At some point we have to discuss MMT)
NIPA and SOI data for Black income were estimated. NIPA and SOI data is not broken down by race, so we used the CPS household income ratios. (Editors note: At some point we will have to go back and recalculate the ratios based on CPS Individual, ACS, and SCF data to see if there is a significant change)
Are there other estimates ?
Yes, Neilsen and UGA Selig center offer estimates. Neilsen is a sales data company, so they have an incentive to make the figures as larger as possible while discussing there expertise in the area. Selig is a think tank.
It’s the middle of 2020 and the data is from December 2018.
Yes, CPS is reported in September for the previous year..
Do people under report income to the IRS ?
Yes, it’s estimated that income could be 30% higher than reported to the IRS.
Do people under report income on the US Census CPS and ACS?
Yes, but the actual amount is unknown. It may also be small. The Congressional Budget Office did a correction for under reported social benefits (probably at the suggestion of a Republican senator) and found very little impact on income from benefits. (Ed Note: double check impact). In addition fringe benefits and imputed rent are not included in the estimates.
What impact would unreported income make? Can we account for illegal profits? What about barter?
In theory “Black” money eventually shows up in the National Income and Product Accounts of the BEA. Everyone goes to the store to buy food.
You you could see an interesting scenario where we get our plumbing fixed and pay cash. The plumber buys weed and pays cash. The weed man goes to the vegan restaurant and pays cash. And the chef pays cash at the organic Black farm. All economic transaction not recorded anywhere, but still workers earning money.
The reality is much different. As soon as someone buys a gallon of gas, a bag of Doritos or toilet paper: bam!, the transaction is recorded. And in the statistics.
Barter is a great idea but almost unworkable in a specialized, branded, advertising driven society. The total amount of bartered goods was estimated at (ed note)
Sources
Neilsen is a global marketing research firm. Neilsen’s Black spending data came from two press releases: PR 2018 and PR 2019. The company produces is a yearly estimate of Black spending power as part of a marketing effort to advertisers.
US Census Bureau — Differences Between American Community Survey(ACS) and Current Population Survey Annual Social and Economic Supplement (CPS ASEC)